
2019 Harvest Predictions: The Growing Season Yields Stress for Our Fearless Farm Leader
The two questions I get asked most frequently are, “How’s the season going?” and, “Do you think it’ll be a (fill in the blank: hot, dry, cold, rainy) year?” It’s like the farmers version of “Hi! How are you?” I never mind answering these questions, as there is always something new and eventful to share, and I jump at any opportunity to bring non-farmers into my farming world in any way possible.
Every year on the farm is drastically different … yet also sort of the same. Not sure what I mean? Take a look at the graph below, which is actual data from Weavers Way Farms from 2014-2018.
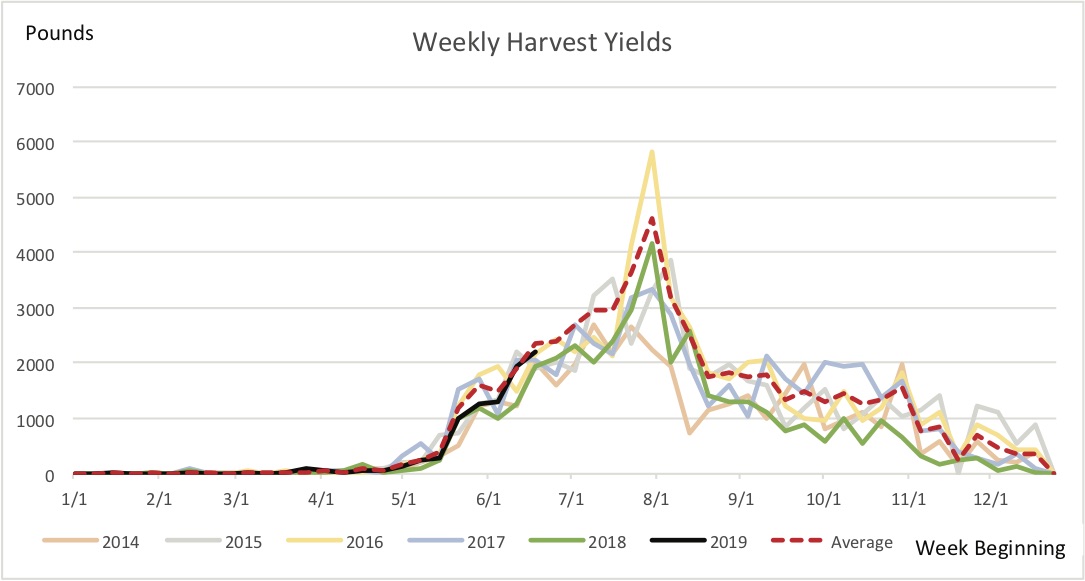
The basic trend is similar year to year: Harvest yields quickly increase until mid-summer, then more gradually decrease until the end of the season. The more detailed narrative goes something like this: From January through April we harvest small amounts of overwintered crops from our four small high tunnels. Mini harvest peaks during this time are a sign of picking from an entire tunnel of kale or baby greens. Then in May we start to harvest a little from the fields, including herbs, salad greens and cooking greens, and then later some fast growing roots like radishes or turnips.
When yields climb upwards in June, our walk-in refrigerators are jam-packed with lightweight lettuce heads, chard, and lettuce mix that are harvested in huge volume to add up to those total pounds you see on the graph. Then in early July, the cooler weather spring crops stop producing and there is a decrease in yield until the heavy summer crops come in.
The tomatoes, squash, cucumbers, eggplant, onions, potatoes and peppers dominate this time. Not only are they abundant, but these types of crops tend to be heavy. The peak of harvest weights in early August always coincides with the largest tomato harvests of the season.
How good the tomato season was can be interpreted from how high that peak is on the graph. When tomatoes crash they crash hard, and late August into September is oddly a low point on the farm. Average yields in early September surprisingly coincide with the average yield at the end of May!
After that drastic decrease, harvests more gracefully plateau or decline, with the harvest of new fall crops that are less time-sensitive. Small peaks in the graph at this time of year coincide with a big winter squash or fall root harvest. They reliably dip the third week in November, which typically means we only harvest once a week instead of two or three times.
Our goal as farmers is to avoid the low points right before and after summer tomatoes, as well as to sustain yields as long as possible during the usual slowdown in the fall. But as we can see from these visual trends, that is no easy feat.
The micro bumps and climbs within that overarching pattern mark the stressful weekly changes that we farmers fret over. The harvest gaps between planting successions, the astonishing yields that make our days longer than expected, the surprising insect damage that makes the same harvest take twice as long … all contribute to the ups and downs of not only yield but also stress. If I were to chart a graph of my personal stress levels, it would look something like the following:
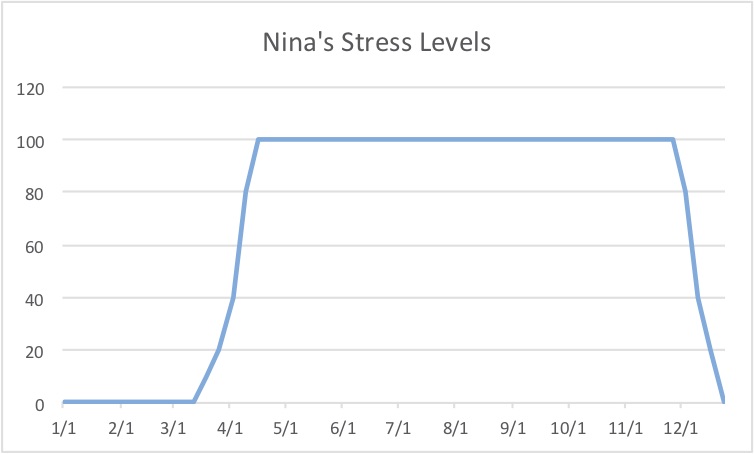
Stress increases as plants go in the ground. Stress is high when yields are low because …. yields are low. Stress is high when yields are high because … yields are high. Also, it’s hard to find outlets for all the product before it rots, and it’s a lot of work harvesting all those veggies!
So the next time someone asks me how the season is going, I’ll have a double-sided graph ready to pull out of my pocket and I can point to where I am on the harvest graph and the stress graph. And if you ask me if I think it’ll be a dry summer … your guess is as good as mine. You’re better off consulting the Farmer’s Almanac, which by the way has been statistically proven to be completely inaccurate!